|
OGRE
master
Object-Oriented Graphics Rendering Engine
|
|
OGRE
master
Object-Oriented Graphics Rendering Engine
|
OGRE_PROFILING=OFF, so instrumentation is disabled by default.First you want to initialize the Profiler like this:
This sets up the media that the profiler uses. The reason this is not in the constructor is because the profiler contains media dependencies that people who aren't using the profiler shouldn't have to worry about. The profiler will need you to specify the main program loop. To do this, you call the following at the very beginning of the frameStarted() function in your FrameListener class:
and add this at the very end of the frameEnded() function:
Make sure the names match exactly, otherwise the profiler will fail an assert. Next you want to profile some of your code. You do this by calling OgreProfile() and using braces ({}) to limit the scope. Note that OgreProfile cannot be called in the same scope as another OgreProfile(). Doing so will result in a compile-time error. Here is an example of using OgreProfile:
If you want a profile to last outside of its scope, use OgreProfileBegin(<name>) and OgreProfileEnd(<name>) like you did when creating the main loop profile.
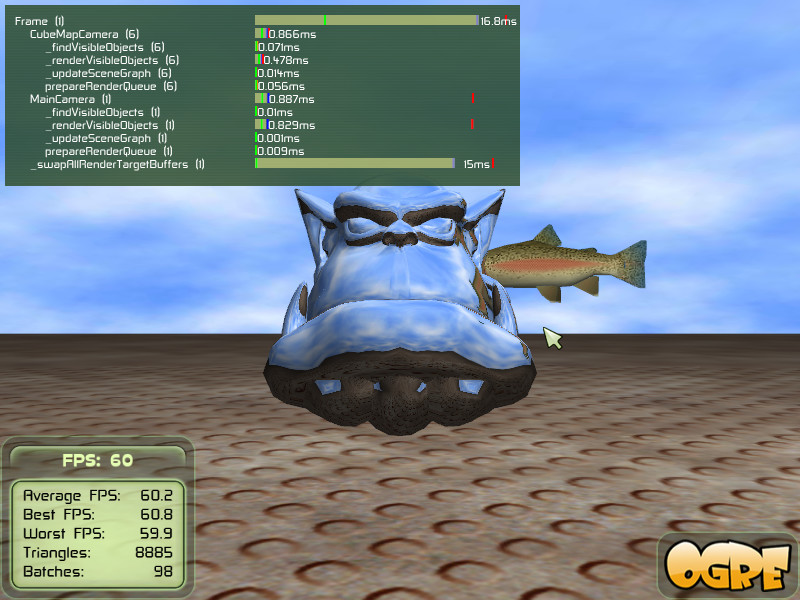
On the left side are the profile names with a number in parentheses next to it. This number is the number of times this profile was called during this frame. If this number is 0, that means that the profile was called before, but is not being called currently. The bars on the left represent the frame time statistics. You can see indicators above which show that a profile can take anywhere from 0% to 100% of the frame time. The big yellow bars show the current frame percentage that the profile is taking. The green line shows the minimum frame time, the red line is the maximum frame time, and the blue line is the average frame time. Big discrepancies between the average and maximum can possibly be the sign of a performance bottleneck (however it could be the profiler acting strangely, see the ''Known Issues'' section). These results will be printed to the log when the application ends or you can manually do it by calling logResults().
You can disable the profiler by calling:
and enable it again by calling:
Note that this is a temporary solution. If you want to completely disable the profiler for your release version, see the section ''Release Version Considerations''.
Disabling profiles can be useful if there are certain core functions that you want to profile on occasion. For example, you could profile certain rendering operations when you are checking general performance and then disable those profiles when you want to profile your AI code. You can disable a profile like this:
and you can enable it again with this:
Please note that trying to enable or disable a profile while that profile is running will have no effect.
It is helpful to see the state of your application when a profile reaches a maximum level or some other condition. To check if a specific has reached a new maximum level, use:
or to see if a profile has reached a new minimum level, use:
or to set an arbitrary level:
These functions should be used at the end of the main game loop for more accuracy. Otherwise, it will represent the results of the previous frame.
You can log the results of the current profiler statistics like this:
This is called automatically when you quit your Ogre application.
You can change how frequently the display is updated to suit your tastes like this:
Basically the tradeoff is between how accurate the display is and the amount of flicker. The default is that the display is updated every 10 frames.
I've tried to minimize the performance hit from using the profiler. However, like anything else, it still takes some time to perform the necessary calculations. There are some steps you can take to increase the accuracy of the results. Firstly, although the profiler supports multiple calls of a profile during each frame, doing this more than a few times can cause the profiler to take significantly longer than the actual code you are trying to profile. Therefore it is recommended that you move the profile up one level (such as outside of a for loop) so that it is called fewer times.
To maximize the accuracy of a profile, it is best to remove the child profiles of the profile you are analysing. Child profiles increases the frame time of the parent due to the overhead of using the profiler.
Some tests I've conducted show that the profiling code will max out unexpectedly, so take the maximum frame time value with a grain of salt (See the Known Issues section). I think this only happens when a profile is first created, so you can possibly get around this issue by calling the reset() function after the first frame.
If you need some more overview or want to profile a remote device, the profiler optionally supports using Remotery.
To enable the Remotery backend set OGRE_PROFILING_REMOTERY_PATH in CMake to point to the Remotery/lib directory (containing Remotery.c). Remotery will be compiled into OgreMain and can be accessed as usual.
Note that no features besides Ogre::Profiler::setEnabled are available when using Remotery.
For the release version of your app, you should set OGRE_PROFILING=OFF in CMake. If the build you are using has been compiled with the OGRE_PROFILING=OFF and you still want to use instrumentation, you can instantiate a dummy profiler like this:
The profiler will now work but the 3 OgreProfile macro will not work. You will have to manually use the beginProfile() and endProfile() method. You can also instantiate scope-limited Profile objects or simply define your own macros somewhere in your code.
 1.8.13