Can be created using the CrombieTools.PlotTools.PlotBrazil module. More...
#include <PlotBrazil.h>
 Inheritance diagram for PlotBrazil:
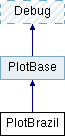
Public Member Functions | |
| PlotBrazil (TString fileName="") | |
| Default constructor. More... | |
| virtual | ~PlotBrazil () |
| void | AddPoint (Double_t point, Double_t observed, Double_t lowest, Double_t low, Double_t mid, Double_t high, Double_t highest) |
| Add a point to all of the appropriate TGraphs. More... | |
| void | MakePlot (TString FileBase, TString XLabel, TString YLabel, Bool_t logY=false, Bool_t logX=false) |
| Creates a Brazilian plot using the stored limits. More... | |
| void | ReadConfig (TString filename) |
| Reads the list of points from a configuration file to set up the TGraphs. More... | |
| Public Member Functions inherited from PlotBase | |
| PlotBase () | |
| virtual | ~PlotBase () |
| void | AddCutLine (Double_t loc, bool is_vert=true) |
| Adds a dotted line in order to show cuts. More... | |
| void | AddExpr (TString expr) |
| Set an x expression for a single line. More... | |
| void | AddLegendEntry (TString LegendEntry, Color_t ColorEntry) |
| Set entry and color for each line. This uses the default line width and style. More... | |
| void | AddLegendEntry (TString LegendEntry, Color_t ColorEntry, Int_t LineWidth, Int_t LineStyle) |
| Set entry, color, width, and style for each line. More... | |
| void | AddLine (TTree *tree, TCut cut, TString expr) |
| This function adds a tree pointer, cut, and expression used for generating a line in the plot. More... | |
| void | AddLine (TTree *tree, const char *cut, TString expr) |
| This function adds a tree pointer, cut, and expression used for generating a line in the plot. More... | |
| void | AddRatioLine (Int_t line) |
| Add a line to show in the ratio plot. More... | |
| void | AddSystematicBranch (TString branch) |
| Add branches that contain independent systematic uncertainties to show in the plots. More... | |
| void | AddTree (TTree *tree) |
| Set a tree for a single line. More... | |
| void | AddTreeExpr (TTree *tree, TString expr) |
| Set a tree and expression concurrently for each line. Best used when a default weight is set. More... | |
| void | AddTreeWeight (TTree *tree, TCut cut) |
| Set a tree and weight concurrently for each line. Best used when a default expression is set. More... | |
| void | AddTreeWeight (TTree *tree, const char *cut) |
| Set a tree and weight concurrently for each line. Best used when a default expression is set. More... | |
| void | AddWeight (TCut cut) |
| Set a weight for a single line. More... | |
| void | AddWeight (const char *cut) |
| Set a weight for a single line. More... | |
| void | AddWeightExpr (TCut cut, TString expr) |
| Set a weight and expression concurrently for each line. Best used when a default tree is set. More... | |
| void | AddWeightExpr (const char *cut, TString expr) |
| Set a weight and expression concurrently for each line. Best used when a default tree is set. More... | |
| TCut | GetDefaultWeight () const |
| Get the default weight. More... | |
| void | OnlyPDF () |
| Call this before plotting to only write plots to .pdf files. More... | |
| void | OnlyPNG () |
| Call this before plotting to only write plots to .png files. More... | |
| void | ResetCutLines () |
| Resets the number of cut lines to plot. More... | |
| void | ResetExpr () |
| Reset the list of expressions used to makes lines. More... | |
| void | ResetLegend () |
| Resets the legend entries for each line. More... | |
| void | ResetSystematics () |
| Reset list of branches that contain systematics. More... | |
| void | ResetTree () |
| Reset the list of trees used to makes lines. More... | |
| void | ResetWeight () |
| Reset the list of weights used to makes lines. More... | |
| void | SetAxisMinMax (Float_t min, Float_t max) |
| Forces the minimum and maximum values of the Y-axis in the plot. More... | |
| void | SetAxisTitleOffset (Float_t offset) |
| Sets the offset of the Y-axis title as a ratio of the default offset. More... | |
| void | SetCanvasName (TString name) |
| Sets the name of the canvas created by PlotBase. More... | |
| void | SetCanvasSize (Int_t width, Int_t height) |
| Sets the size of the output canvas. More... | |
| void | SetCMSLabel (TString type) |
| Set the type of CMS label for the plot. More... | |
| void | SetCutLineStyle (Color_t color, Int_t width, Int_t style) |
| Sets the style for the cut lines. More... | |
| void | SetDataIndex (Int_t data) |
| Set one of the lines to be plotted as data. More... | |
| void | SetDefaultCut (const char *cut) |
| void | SetDefaultExpr (TString expr) |
| Set the default expression to be plotted on the x-axis for each line in the plot. More... | |
| void | SetDefaultLineStyle (Int_t style) |
| Set the default line style. More... | |
| void | SetDefaultLineWidth (Int_t width) |
| Set the default line width. More... | |
| void | SetDefaultTree (TTree *tree) |
| Set the default tree pointer for each line in the plot. More... | |
| void | SetDefaultWeight (TCut cut) |
| Set the default weight for each line in the plot. More... | |
| void | SetDefaultWeight (const char *cut) |
| Set the default weight for each line in the plot. More... | |
| void | SetDrawFirst (Int_t first) |
| Force a line to draw first on the plot, if desired. More... | |
| void | SetDrawOpts (TString options) |
| Set additional drawing options to force all lines to have. More... | |
| void | SetFontSize (Float_t fontSize) |
| Sets the fontsize of the axis labels. More... | |
| void | SetIncludeErrorBars (Bool_t include) |
| Set this to true to feature error bars in the plots. More... | |
| void | SetLeftMargin (float left) |
| void | SetLegendBorderSize (Int_t size) |
| Set the legend border size. More... | |
| void | SetLegendFill (Bool_t fill) |
| If true, the legend will be filled with a solid background. More... | |
| void | SetLegendLimits (Double_t lim1, Double_t lim2, Double_t lim3, Double_t lim4) |
| Set the legend location manually. More... | |
| void | SetLegendLocation (LegendY yLoc, LegendX xLoc, Double_t xWidth=0.3, Double_t yWidth=0.2) |
| Set the legend location using LegendY and LegendX enums. More... | |
| void | SetLumiLabel (TString lumi) |
| Set the luminosity label. More... | |
| void | SetLumiLabel (Float_t lumi) |
| Set the luminosity lable with a float in fb. More... | |
| void | SetLumiLabelFormat (TString format) |
| Set the luminosity format. More... | |
| void | SetMakeRatio (Bool_t ratio) |
| If true, a ratio pad will be drawn underneath. More... | |
| void | SetRatioDivisions (Int_t divisions, Bool_t optimize=true) |
| Sets the divisions of the ratio y axis. More... | |
| void | SetRatioGrid (Int_t grid) |
| Set horizontal dotted lines on the ratio pad. More... | |
| void | SetRatioIndex (Int_t ratio) |
| Set which line will be '1' in the ratio plot. More... | |
| void | SetRatioMinMax (Float_t min, Float_t max) |
| Force the minimum and maximum values of the ratio pad. More... | |
| void | SetRatioTitle (TString title) |
| Set the y axis label of the ratio pad. More... | |
| void | SetTreeList (std::vector< TTree *> treelist) |
| Can store multiple trees at once for plots. Each tree plots its own line. More... | |
| Public Member Functions inherited from Debug | |
| Debug () | |
| virtual | ~Debug () |
| DebugLevel | GetDebugLevel () |
| Gets the verbosity for a class. More... | |
| template<typename T , typename... V> | |
| void | Message (DebugLevel level, T message, V... more) |
| Sends a message if the verbosity level is appropriate. More... | |
| void | Message (DebugLevel level) |
| void | SetDebugLevel (DebugLevel level) |
| Sets the verbosity for a class. More... | |
Private Attributes | |
| TGraphErrors | fExpected |
| The TGraph showing the expected limit. More... | |
| TGraphErrors | fObserved |
| The TGraph showing the observed limit. More... | |
| TGraphErrors | fOneSigma |
| The TGraph holding the 1-sigma band. More... | |
| TGraphErrors | fTwoSigma |
| The TGraph holding the 2-sigma band. More... | |
Additional Inherited Members | |
| Public Types inherited from PlotBase | |
| enum | LegendX { kLeft = 0, kRight } |
| Used for horizontal position of legend. More... | |
| enum | LegendY { kUpper = 0, kLower } |
| Used for vertical position of legend. More... | |
| Public Types inherited from Debug | |
| enum | DebugLevel { eQuiet = 0, eError, eInfo, eDebug } |
| Different possible debug levels. More... | |
| Protected Member Functions inherited from PlotBase | |
| template<class T > | |
| void | BaseCanvas (TString FileBase, std::vector< T *> theLines, TString XLabel, TString YLabel, Bool_t logY=false, Bool_t logX=false) |
| This is the powerhouse of all the plotting tools. Everything happens here. More... | |
| void | ConvertToArray (Int_t NumXBins, Double_t MinX, Double_t MaxX, Double_t *XBins) |
| Takes number of bins, min and max, and dumps it into an already allocated array. More... | |
| TString | TempHistName () |
| Get a temporary name for a histogram. More... | |
| Protected Member Functions inherited from Debug | |
| void | DisplayFunc (const char *func) |
| Sends the name of the function during debuggin. More... | |
| Protected Attributes inherited from PlotBase | |
| Bool_t | bC = true |
| If true, BaseCanvas will create a .C macro. More... | |
| Bool_t | bPDF = true |
| If true, BaseCanvas will create a .pdf file. More... | |
| Bool_t | bPNG = true |
| If true, BaseCanvas will create a .png file. More... | |
| Float_t | fAxisMax = 0.0 |
| Maximum value of the y-axis. More... | |
| Float_t | fAxisMin = 0.0 |
| Minimum value of the y-axis. More... | |
| Int_t | fDataIndex = -1 |
| Index in the plotter of the data line. More... | |
| TCut | fDefaultCut = "" |
| Default cut if needed. More... | |
| TString | fDefaultExpr = "" |
| Default resolution expression if needed. More... | |
| TTree * | fDefaultTree = NULL |
| Default Tree if needed. More... | |
| Bool_t | fIncludeErrorBars = true |
| Option to include error bars. More... | |
| std::vector< TCut > | fInCuts |
| Holds the cuts for the trees if needed. More... | |
| std::vector< TString > | fInExpr |
| Holds multiple resolution expressions if needed. More... | |
| std::vector< TTree * > | fInTrees |
| Holds all the trees for each line if needed. More... | |
| Int_t | fLegendBorderSize = 0 |
| Border size of legend. More... | |
| std::vector< TString > | fLegendEntries |
| Number of legend entries should match number of lines. More... | |
| Bool_t | fMakeRatio = false |
| Bool to make a ratio plot on bottom of image. More... | |
| Bool_t | fOptimDivisions |
| UInt_t | fPlotCounter = 0 |
| This is used so that making scratch plots does not overlap. More... | |
| Int_t | fRatioDivisions |
| Int_t | fRatioGrid |
| Int_t | fRatioIndex = -1 |
| Pick which line to set as 1 in ratio plot. More... | |
| std::vector< Int_t > | fRatioLines |
| Vector of line indices to show up in the ratio pad. More... | |
| Float_t | fRatioMax = 0.0 |
| Maximum of the ratio pad. More... | |
| Float_t | fRatioMin = 0.0 |
| Minimum of the ratio pad. More... | |
| TString | fRatioTitle |
| Label of the ratio pad. More... | |
| std::vector< TString > | fSystematicBranches |
| Vector of branches to apply as systematic uncertainties. More... | |
| Double_t | l1 = 0.6 |
| First X value of legend location. More... | |
| Double_t | l2 = 0.7 |
| First Y value of legend location. More... | |
| Double_t | l3 = 0.9 |
| Second X value of legend location. More... | |
| Double_t | l4 = 0.9 |
| Second Y value of legend location. More... | |
Detailed Description
Can be created using the CrombieTools.PlotTools.PlotBrazil module.
Class used to create Brazilian plots from a .txt file.
Definition at line 22 of file PlotBrazil.h.
Constructor & Destructor Documentation
§ PlotBrazil()
| PlotBrazil::PlotBrazil | ( | TString | fileName = "" | ) |
Default constructor.
§ ~PlotBrazil()
|
virtual |
Definition at line 29 of file PlotBrazil.cc.
Member Function Documentation
§ AddPoint()
| void PlotBrazil::AddPoint | ( | Double_t | point, |
| Double_t | observed, | ||
| Double_t | lowest, | ||
| Double_t | low, | ||
| Double_t | mid, | ||
| Double_t | high, | ||
| Double_t | highest | ||
| ) |
Add a point to all of the appropriate TGraphs.
Definition at line 35 of file PlotBrazil.cc.
References Debug::DisplayFunc(), Debug::eDebug, fExpected, fObserved, fOneSigma, fTwoSigma, and Debug::Message().
Referenced by ReadConfig().
§ MakePlot()
| void PlotBrazil::MakePlot | ( | TString | FileBase, |
| TString | XLabel, | ||
| TString | YLabel, | ||
| Bool_t | logY = false, |
||
| Bool_t | logX = false |
||
| ) |
Creates a Brazilian plot using the stored limits.
Definition at line 99 of file PlotBrazil.cc.
References PlotBase::BaseCanvas(), fExpected, fObserved, fOneSigma, fTwoSigma, and PlotBase::SetDrawFirst().
§ ReadConfig()
| void PlotBrazil::ReadConfig | ( | TString | filename | ) |
Reads the list of points from a configuration file to set up the TGraphs.
Definition at line 71 of file PlotBrazil.cc.
References AddPoint(), Debug::DisplayFunc(), Debug::eInfo, and Debug::Message().
Member Data Documentation
§ fExpected
|
private |
The TGraph showing the expected limit.
Definition at line 43 of file PlotBrazil.h.
Referenced by AddPoint(), and MakePlot().
§ fObserved
|
private |
The TGraph showing the observed limit.
Definition at line 44 of file PlotBrazil.h.
Referenced by AddPoint(), and MakePlot().
§ fOneSigma
|
private |
The TGraph holding the 1-sigma band.
Definition at line 41 of file PlotBrazil.h.
Referenced by AddPoint(), and MakePlot().
§ fTwoSigma
|
private |
The TGraph holding the 2-sigma band.
Definition at line 42 of file PlotBrazil.h.
Referenced by AddPoint(), and MakePlot().
The documentation for this class was generated from the following files:
