Base class for all plotting classes. More...
#include <PlotBase.h>
 Inheritance diagram for PlotBase:
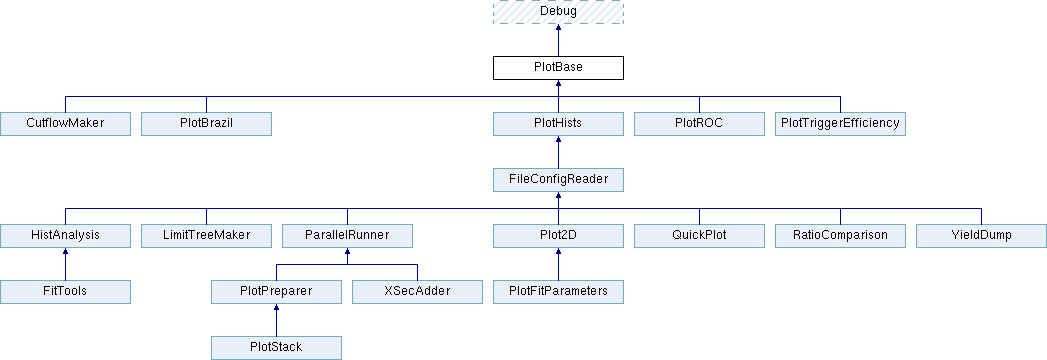
Public Types | |
| enum | LegendX { kLeft = 0, kRight } |
| Used for horizontal position of legend. More... | |
| enum | LegendY { kUpper = 0, kLower } |
| Used for vertical position of legend. More... | |
| Public Types inherited from Debug | |
| enum | DebugLevel { eQuiet = 0, eError, eInfo, eDebug } |
| Different possible debug levels. More... | |
Public Member Functions | |
| PlotBase () | |
| virtual | ~PlotBase () |
| void | AddCutLine (Double_t loc, bool is_vert=true) |
| Adds a dotted line in order to show cuts. More... | |
| void | AddExpr (TString expr) |
| Set an x expression for a single line. More... | |
| void | AddLegendEntry (TString LegendEntry, Color_t ColorEntry) |
| Set entry and color for each line. This uses the default line width and style. More... | |
| void | AddLegendEntry (TString LegendEntry, Color_t ColorEntry, Int_t LineWidth, Int_t LineStyle) |
| Set entry, color, width, and style for each line. More... | |
| void | AddLine (TTree *tree, TCut cut, TString expr) |
| This function adds a tree pointer, cut, and expression used for generating a line in the plot. More... | |
| void | AddLine (TTree *tree, const char *cut, TString expr) |
| This function adds a tree pointer, cut, and expression used for generating a line in the plot. More... | |
| void | AddRatioLine (Int_t line) |
| Add a line to show in the ratio plot. More... | |
| void | AddSystematicBranch (TString branch) |
| Add branches that contain independent systematic uncertainties to show in the plots. More... | |
| void | AddTree (TTree *tree) |
| Set a tree for a single line. More... | |
| void | AddTreeExpr (TTree *tree, TString expr) |
| Set a tree and expression concurrently for each line. Best used when a default weight is set. More... | |
| void | AddTreeWeight (TTree *tree, TCut cut) |
| Set a tree and weight concurrently for each line. Best used when a default expression is set. More... | |
| void | AddTreeWeight (TTree *tree, const char *cut) |
| Set a tree and weight concurrently for each line. Best used when a default expression is set. More... | |
| void | AddWeight (TCut cut) |
| Set a weight for a single line. More... | |
| void | AddWeight (const char *cut) |
| Set a weight for a single line. More... | |
| void | AddWeightExpr (TCut cut, TString expr) |
| Set a weight and expression concurrently for each line. Best used when a default tree is set. More... | |
| void | AddWeightExpr (const char *cut, TString expr) |
| Set a weight and expression concurrently for each line. Best used when a default tree is set. More... | |
| TCut | GetDefaultWeight () const |
| Get the default weight. More... | |
| void | OnlyPDF () |
| Call this before plotting to only write plots to .pdf files. More... | |
| void | OnlyPNG () |
| Call this before plotting to only write plots to .png files. More... | |
| void | ResetCutLines () |
| Resets the number of cut lines to plot. More... | |
| void | ResetExpr () |
| Reset the list of expressions used to makes lines. More... | |
| void | ResetLegend () |
| Resets the legend entries for each line. More... | |
| void | ResetSystematics () |
| Reset list of branches that contain systematics. More... | |
| void | ResetTree () |
| Reset the list of trees used to makes lines. More... | |
| void | ResetWeight () |
| Reset the list of weights used to makes lines. More... | |
| void | SetAxisMinMax (Float_t min, Float_t max) |
| Forces the minimum and maximum values of the Y-axis in the plot. More... | |
| void | SetAxisTitleOffset (Float_t offset) |
| Sets the offset of the Y-axis title as a ratio of the default offset. More... | |
| void | SetCanvasName (TString name) |
| Sets the name of the canvas created by PlotBase. More... | |
| void | SetCanvasSize (Int_t width, Int_t height) |
| Sets the size of the output canvas. More... | |
| void | SetCMSLabel (TString type) |
| Set the type of CMS label for the plot. More... | |
| void | SetCutLineStyle (Color_t color, Int_t width, Int_t style) |
| Sets the style for the cut lines. More... | |
| void | SetDataIndex (Int_t data) |
| Set one of the lines to be plotted as data. More... | |
| void | SetDefaultCut (const char *cut) |
| void | SetDefaultExpr (TString expr) |
| Set the default expression to be plotted on the x-axis for each line in the plot. More... | |
| void | SetDefaultLineStyle (Int_t style) |
| Set the default line style. More... | |
| void | SetDefaultLineWidth (Int_t width) |
| Set the default line width. More... | |
| void | SetDefaultTree (TTree *tree) |
| Set the default tree pointer for each line in the plot. More... | |
| void | SetDefaultWeight (TCut cut) |
| Set the default weight for each line in the plot. More... | |
| void | SetDefaultWeight (const char *cut) |
| Set the default weight for each line in the plot. More... | |
| void | SetDrawFirst (Int_t first) |
| Force a line to draw first on the plot, if desired. More... | |
| void | SetDrawOpts (TString options) |
| Set additional drawing options to force all lines to have. More... | |
| void | SetFontSize (Float_t fontSize) |
| Sets the fontsize of the axis labels. More... | |
| void | SetIncludeErrorBars (Bool_t include) |
| Set this to true to feature error bars in the plots. More... | |
| void | SetLeftMargin (float left) |
| void | SetLegendBorderSize (Int_t size) |
| Set the legend border size. More... | |
| void | SetLegendFill (Bool_t fill) |
| If true, the legend will be filled with a solid background. More... | |
| void | SetLegendLimits (Double_t lim1, Double_t lim2, Double_t lim3, Double_t lim4) |
| Set the legend location manually. More... | |
| void | SetLegendLocation (LegendY yLoc, LegendX xLoc, Double_t xWidth=0.3, Double_t yWidth=0.2) |
| Set the legend location using LegendY and LegendX enums. More... | |
| void | SetLumiLabel (TString lumi) |
| Set the luminosity label. More... | |
| void | SetLumiLabel (Float_t lumi) |
| Set the luminosity lable with a float in fb. More... | |
| void | SetLumiLabelFormat (TString format) |
| Set the luminosity format. More... | |
| void | SetMakeRatio (Bool_t ratio) |
| If true, a ratio pad will be drawn underneath. More... | |
| void | SetRatioDivisions (Int_t divisions, Bool_t optimize=true) |
| Sets the divisions of the ratio y axis. More... | |
| void | SetRatioGrid (Int_t grid) |
| Set horizontal dotted lines on the ratio pad. More... | |
| void | SetRatioIndex (Int_t ratio) |
| Set which line will be '1' in the ratio plot. More... | |
| void | SetRatioMinMax (Float_t min, Float_t max) |
| Force the minimum and maximum values of the ratio pad. More... | |
| void | SetRatioTitle (TString title) |
| Set the y axis label of the ratio pad. More... | |
| void | SetTreeList (std::vector< TTree *> treelist) |
| Can store multiple trees at once for plots. Each tree plots its own line. More... | |
| Public Member Functions inherited from Debug | |
| Debug () | |
| virtual | ~Debug () |
| DebugLevel | GetDebugLevel () |
| Gets the verbosity for a class. More... | |
| template<typename T , typename... V> | |
| void | Message (DebugLevel level, T message, V... more) |
| Sends a message if the verbosity level is appropriate. More... | |
| void | Message (DebugLevel level) |
| void | SetDebugLevel (DebugLevel level) |
| Sets the verbosity for a class. More... | |
Protected Member Functions | |
| template<class T > | |
| void | BaseCanvas (TString FileBase, std::vector< T *> theLines, TString XLabel, TString YLabel, Bool_t logY=false, Bool_t logX=false) |
| This is the powerhouse of all the plotting tools. Everything happens here. More... | |
| void | ConvertToArray (Int_t NumXBins, Double_t MinX, Double_t MaxX, Double_t *XBins) |
| Takes number of bins, min and max, and dumps it into an already allocated array. More... | |
| TString | TempHistName () |
| Get a temporary name for a histogram. More... | |
| Protected Member Functions inherited from Debug | |
| void | DisplayFunc (const char *func) |
| Sends the name of the function during debuggin. More... | |
Protected Attributes | |
| Bool_t | bC = true |
| If true, BaseCanvas will create a .C macro. More... | |
| Bool_t | bPDF = true |
| If true, BaseCanvas will create a .pdf file. More... | |
| Bool_t | bPNG = true |
| If true, BaseCanvas will create a .png file. More... | |
| Float_t | fAxisMax = 0.0 |
| Maximum value of the y-axis. More... | |
| Float_t | fAxisMin = 0.0 |
| Minimum value of the y-axis. More... | |
| Int_t | fDataIndex = -1 |
| Index in the plotter of the data line. More... | |
| TCut | fDefaultCut = "" |
| Default cut if needed. More... | |
| TString | fDefaultExpr = "" |
| Default resolution expression if needed. More... | |
| TTree * | fDefaultTree = NULL |
| Default Tree if needed. More... | |
| Bool_t | fIncludeErrorBars = true |
| Option to include error bars. More... | |
| std::vector< TCut > | fInCuts |
| Holds the cuts for the trees if needed. More... | |
| std::vector< TString > | fInExpr |
| Holds multiple resolution expressions if needed. More... | |
| std::vector< TTree * > | fInTrees |
| Holds all the trees for each line if needed. More... | |
| Int_t | fLegendBorderSize = 0 |
| Border size of legend. More... | |
| std::vector< TString > | fLegendEntries |
| Number of legend entries should match number of lines. More... | |
| Bool_t | fMakeRatio = false |
| Bool to make a ratio plot on bottom of image. More... | |
| Bool_t | fOptimDivisions |
| UInt_t | fPlotCounter = 0 |
| This is used so that making scratch plots does not overlap. More... | |
| Int_t | fRatioDivisions |
| Int_t | fRatioGrid |
| Int_t | fRatioIndex = -1 |
| Pick which line to set as 1 in ratio plot. More... | |
| std::vector< Int_t > | fRatioLines |
| Vector of line indices to show up in the ratio pad. More... | |
| Float_t | fRatioMax = 0.0 |
| Maximum of the ratio pad. More... | |
| Float_t | fRatioMin = 0.0 |
| Minimum of the ratio pad. More... | |
| TString | fRatioTitle |
| Label of the ratio pad. More... | |
| std::vector< TString > | fSystematicBranches |
| Vector of branches to apply as systematic uncertainties. More... | |
| Double_t | l1 = 0.6 |
| First X value of legend location. More... | |
| Double_t | l2 = 0.7 |
| First Y value of legend location. More... | |
| Double_t | l3 = 0.9 |
| Second X value of legend location. More... | |
| Double_t | l4 = 0.9 |
| Second Y value of legend location. More... | |
Private Member Functions | |
| void | DrawCutLines () |
| Draws the cuts lines. More... | |
| template<class T > | |
| TString | GetOpts (T *) |
| Options for lines. More... | |
| template<class T > | |
| void | LineDrawing (std::vector< T *> theLines, Int_t index, Bool_t same) |
| Use this to get certain draw options correct (for data, for example) More... | |
Private Attributes | |
| Int_t | fCanvasHeight = 600 |
| The height of the output canvas. More... | |
| TString | fCanvasName = "canvas" |
| The name of the output canvas. More... | |
| Int_t | fCanvasWidth = 600 |
| The width of the output canvas. More... | |
| TString | fCMSLabel = "" |
| Label to give next to CMS on plots. More... | |
| Color_t | fCutColor = kRed |
| Color of the cuts lines. More... | |
| std::vector< std::pair< Double_t, bool > > | fCutLines |
| Locations for dashed lines for cuts, and bools for verticality. More... | |
| Int_t | fCutStyle = 2 |
| Style of the cuts lines. More... | |
| Int_t | fCutWidth = 2 |
| Width of the cuts lines. More... | |
| Double_t | fCutXMax = 0.0 |
| Maximum value of cut line x. More... | |
| Double_t | fCutXMin = 0.0 |
| Minimum value of cut line x. More... | |
| Double_t | fCutYMax = 0.0 |
| Maximum value of cut line y. More... | |
| Double_t | fCutYMin = 0.0 |
| Minimum value of cut line y. More... | |
| Int_t | fDefaultLineStyle = 1 |
| Line style to use on all plots. More... | |
| Int_t | fDefaultLineWidth = 2 |
| Line width to make all plots. More... | |
| std::vector< TObject * > | fDeleteThese |
| Vector of object pointers to free memory at the end. More... | |
| Int_t | fDrawFirst |
| Can force one of the lines to be drawn first. More... | |
| TString | fDrawOpts = "" |
| The options that all lines are drawn with. More... | |
| Float_t | fFontSize = 0.04 |
| The size of the font used in the axis titles. More... | |
| float | fLeftMargin = 0.0 |
| Bool_t | fLegendFill = false |
| Gives fill option to legend drawing. More... | |
| std::vector< Color_t > | fLineColors |
| Colors of each of the lines. More... | |
| std::vector< Int_t > | fLineStyles |
| Styles of each of the lines. More... | |
| std::vector< Int_t > | fLineWidths |
| Widths of each of the lines. More... | |
| TString | fLumiLabel = "" |
| Label used to show luminosity. More... | |
| TString | fLumiLabelFormat = "%.1f" |
| Format used for changing lumi numbers into string. More... | |
| Float_t | fTitleOffset = 1.0 |
| The offset of the Y-axis title to account for large numbers. More... | |
Detailed Description
Base class for all plotting classes.
PlotBase holds much of the parameters used for plotting various kinds of plots. It also holds all of the functions that are used to create and save the canvas.
Definition at line 41 of file PlotBase.h.
Member Enumeration Documentation
§ LegendX
| enum PlotBase::LegendX |
Used for horizontal position of legend.
| Enumerator | |
|---|---|
| kLeft | Places the plot legend on the left part of the canvas. |
| kRight | Places the plot legend on the right part of the canvas. |
Definition at line 125 of file PlotBase.h.
§ LegendY
| enum PlotBase::LegendY |
Used for vertical position of legend.
| Enumerator | |
|---|---|
| kUpper | Places the plot legend on the upper part of the canvas. |
| kLower | Places the plot legend on the lower part of the canvas. |
Definition at line 120 of file PlotBase.h.
Constructor & Destructor Documentation
§ PlotBase()
| PlotBase::PlotBase | ( | ) |
Definition at line 298 of file PlotBase.h.
§ ~PlotBase()
|
virtual |
Definition at line 307 of file PlotBase.h.
Member Function Documentation
§ AddCutLine()
|
inline |
Adds a dotted line in order to show cuts.
Definition at line 182 of file PlotBase.h.
References fCutLines.
§ AddExpr()
|
inline |
Set an x expression for a single line.
Definition at line 103 of file PlotBase.h.
References fInExpr.
§ AddLegendEntry() [1/2]
|
inline |
Set entry and color for each line. This uses the default line width and style.
Definition at line 421 of file PlotBase.h.
References fDefaultLineStyle, fDefaultLineWidth, fLegendEntries, fLineColors, fLineStyles, and fLineWidths.
Referenced by QuickPlot::AddBackground(), RatioComparison::AddRatioCuts(), and PlotStack::MakeCanvas().
§ AddLegendEntry() [2/2]
|
inline |
Set entry, color, width, and style for each line.
Definition at line 431 of file PlotBase.h.
References fLegendEntries, fLineColors, fLineStyles, and fLineWidths.
§ AddLine() [1/2]
|
inline |
This function adds a tree pointer, cut, and expression used for generating a line in the plot.
Definition at line 311 of file PlotBase.h.
References Debug::eError, fDefaultCut, fDefaultExpr, fDefaultTree, fInCuts, fInExpr, fInTrees, and Debug::Message().
§ AddLine() [2/2]
|
inline |
This function adds a tree pointer, cut, and expression used for generating a line in the plot.
Definition at line 63 of file PlotBase.h.
References AddLine().
Referenced by AddLine().
§ AddRatioLine()
|
inline |
Add a line to show in the ratio plot.
The line is specified by its index. If this list is empty, all of the lines appear in the ratio pad.
Definition at line 155 of file PlotBase.h.
References fRatioLines.
Referenced by PlotStack::MakeCanvas().
§ AddSystematicBranch()
|
inline |
Add branches that contain independent systematic uncertainties to show in the plots.
Definition at line 189 of file PlotBase.h.
References fSystematicBranches.
§ AddTree()
|
inline |
§ AddTreeExpr()
|
inline |
Set a tree and expression concurrently for each line. Best used when a default weight is set.
Definition at line 352 of file PlotBase.h.
References Debug::eError, fDefaultCut, fDefaultExpr, fDefaultTree, fInExpr, fInTrees, and Debug::Message().
§ AddTreeWeight() [1/2]
|
inline |
Set a tree and weight concurrently for each line. Best used when a default expression is set.
Definition at line 332 of file PlotBase.h.
References Debug::eError, fDefaultCut, fDefaultExpr, fDefaultTree, fInCuts, fInTrees, and Debug::Message().
Referenced by PlotROC::MakeROC().
§ AddTreeWeight() [2/2]
|
inline |
Set a tree and weight concurrently for each line. Best used when a default expression is set.
Definition at line 66 of file PlotBase.h.
References AddTreeWeight().
Referenced by AddTreeWeight().
§ AddWeight() [1/2]
|
inline |
Set a weight for a single line.
Definition at line 99 of file PlotBase.h.
References fInCuts.
Referenced by TmvaClassifier::Apply().
§ AddWeight() [2/2]
|
inline |
Set a weight for a single line.
Definition at line 101 of file PlotBase.h.
References AddWeight().
Referenced by AddWeight().
§ AddWeightExpr() [1/2]
|
inline |
Set a weight and expression concurrently for each line. Best used when a default tree is set.
Definition at line 372 of file PlotBase.h.
References Debug::eError, fDefaultCut, fDefaultExpr, fDefaultTree, fInCuts, fInExpr, and Debug::Message().
§ AddWeightExpr() [2/2]
|
inline |
Set a weight and expression concurrently for each line. Best used when a default tree is set.
Definition at line 68 of file PlotBase.h.
References AddWeightExpr().
Referenced by AddWeightExpr().
§ BaseCanvas()
|
protected |
This is the powerhouse of all the plotting tools. Everything happens here.
Main macro of the plotters.
Definition at line 561 of file PlotBase.h.
References bC, bPDF, bPNG, Debug::DisplayFunc(), DrawCutLines(), Debug::eDebug, Debug::eError, Debug::eInfo, fAxisMax, fAxisMin, fCanvasHeight, fCanvasName, fCanvasWidth, fCMSLabel, fDataIndex, fDefaultLineStyle, fDefaultLineWidth, fDeleteThese, fDrawFirst, fFontSize, fLeftMargin, fLegendBorderSize, fLegendEntries, fLegendFill, fLineColors, fLineStyles, fLineWidths, fLumiLabel, fMakeRatio, fOptimDivisions, fRatioDivisions, fRatioGrid, fRatioIndex, fRatioLines, fRatioMax, fRatioMin, fRatioTitle, fTitleOffset, GetRatioToLine(), l1, l2, l3, l4, LineDrawing(), Debug::Message(), SetupCanvas(), and CrombieTools.PlotTools.PlotUtils::SetZeroError.
Referenced by PlotROC::MakeCanvas(), QuickPlot::MakeCanvas(), Plot2D::MakeCanvas(), PlotHists::MakeCanvas(), PlotStack::MakeCanvas(), RatioComparison::MakeCompare(), PlotBrazil::MakePlot(), CutflowMaker::MakePlot(), and HistAnalysis::PlotScaleFactors().
§ ConvertToArray()
|
inlineprotected |
Takes number of bins, min and max, and dumps it into an already allocated array.
Definition at line 441 of file PlotBase.h.
Referenced by Plot2D::DoFits(), HistAnalysis::DoScaleFactors(), YieldDump::DumpYieldFiles(), PlotStack::MakeCanvas(), QuickPlot::MakeCanvas(), PlotHists::MakeCanvas(), PlotTriggerEfficiency::MakeCanvas(), RatioComparison::MakeCompare(), PlotHists::MakeHists(), HistAnalysis::MakeReweightHist(), and HistAnalysis::PlotScaleFactors().
§ DrawCutLines()
|
private |
Draws the cuts lines.
Definition at line 450 of file PlotBase.h.
References Debug::eInfo, fCutColor, fCutLines, fCutStyle, fCutWidth, fCutXMax, fCutXMin, fCutYMax, fCutYMin, fDeleteThese, and Debug::Message().
Referenced by BaseCanvas().
§ GetDefaultWeight()
|
inline |
§ GetOpts()
|
private |
Options for lines.
The options for anything derived from a TH1 is "hist".
The options for anything derived from a TGraphErrors is "3".
Definition at line 478 of file PlotBase.h.
References Debug::eDebug, fDrawOpts, and Debug::Message().
Referenced by LineDrawing().
§ LineDrawing()
|
private |
Use this to get certain draw options correct (for data, for example)
This is used instead of Draw for lines so that the draw options are set in one place.
Definition at line 500 of file PlotBase.h.
References Debug::DisplayFunc(), Debug::eDebug, fCutXMax, fCutXMin, fCutYMax, fCutYMin, fDataIndex, fDeleteThese, fRatioIndex, GetOpts(), and Debug::Message().
Referenced by BaseCanvas().
§ OnlyPDF()
|
inline |
Call this before plotting to only write plots to .pdf files.
Definition at line 169 of file PlotBase.h.
§ OnlyPNG()
|
inline |
Call this before plotting to only write plots to .png files.
Definition at line 171 of file PlotBase.h.
§ ResetCutLines()
|
inline |
Resets the number of cut lines to plot.
Definition at line 184 of file PlotBase.h.
References fCutLines.
§ ResetExpr()
|
inline |
Reset the list of expressions used to makes lines.
Definition at line 110 of file PlotBase.h.
References fInExpr.
§ ResetLegend()
|
inline |
Resets the legend entries for each line.
Definition at line 141 of file PlotBase.h.
References fLegendEntries, fLineColors, fLineStyles, and fLineWidths.
Referenced by PlotStack::MakeCanvas(), RatioComparison::Reset(), and QuickPlot::Reset().
§ ResetSystematics()
|
inline |
Reset list of branches that contain systematics.
Definition at line 191 of file PlotBase.h.
References fSystematicBranches.
§ ResetTree()
|
inline |
Reset the list of trees used to makes lines.
Definition at line 106 of file PlotBase.h.
References fInTrees.
Referenced by PlotROC::MakeROC().
§ ResetWeight()
|
inline |
Reset the list of weights used to makes lines.
Definition at line 108 of file PlotBase.h.
References fInCuts.
Referenced by PlotROC::MakeROC().
§ SetAxisMinMax()
|
inline |
Forces the minimum and maximum values of the Y-axis in the plot.
Definition at line 79 of file PlotBase.h.
References fAxisMax, and fAxisMin.
Referenced by PlotROC::MakeCanvas().
§ SetAxisTitleOffset()
|
inline |
Sets the offset of the Y-axis title as a ratio of the default offset.
Definition at line 75 of file PlotBase.h.
References fTitleOffset.
§ SetCanvasName()
|
inline |
Sets the name of the canvas created by PlotBase.
Definition at line 71 of file PlotBase.h.
References fCanvasName.
§ SetCanvasSize()
|
inline |
Sets the size of the output canvas.
Definition at line 73 of file PlotBase.h.
References fCanvasHeight, and fCanvasWidth.
§ SetCMSLabel()
|
inline |
Set the type of CMS label for the plot.
Definition at line 180 of file PlotBase.h.
References fCMSLabel.
§ SetCutLineStyle()
|
inline |
Sets the style for the cut lines.
Definition at line 186 of file PlotBase.h.
§ SetDataIndex()
|
inline |
Set one of the lines to be plotted as data.
Definition at line 145 of file PlotBase.h.
References fDataIndex.
Referenced by PlotStack::MakeCanvas().
§ SetDefaultCut()
|
inline |
Definition at line 85 of file PlotBase.h.
References SetDefaultWeight().
Referenced by YieldDump::DumpYieldFiles().
§ SetDefaultExpr()
|
inline |
Set the default expression to be plotted on the x-axis for each line in the plot.
Definition at line 89 of file PlotBase.h.
References fDefaultExpr.
Referenced by TmvaClassifier::Apply(), FileConfigReader::GetHistList(), HistAnalysis::MakeReweightHist(), and PlotROC::MakeROC().
§ SetDefaultLineStyle()
|
inline |
Set the default line style.
Definition at line 115 of file PlotBase.h.
References fDefaultLineStyle.
§ SetDefaultLineWidth()
|
inline |
Set the default line width.
Definition at line 113 of file PlotBase.h.
References fDefaultLineWidth.
§ SetDefaultTree()
|
inline |
Set the default tree pointer for each line in the plot.
Definition at line 82 of file PlotBase.h.
References fDefaultTree.
Referenced by TmvaClassifier::Apply().
§ SetDefaultWeight() [1/2]
|
inline |
Set the default weight for each line in the plot.
Definition at line 84 of file PlotBase.h.
References fDefaultCut.
Referenced by FileConfigReader::GetHistList(), RatioComparison::MakeCompare(), HistAnalysis::MakeReweightHist(), and SetDefaultCut().
§ SetDefaultWeight() [2/2]
|
inline |
Set the default weight for each line in the plot.
Definition at line 87 of file PlotBase.h.
References SetDefaultWeight().
Referenced by SetDefaultWeight().
§ SetDrawFirst()
|
inline |
Force a line to draw first on the plot, if desired.
Definition at line 166 of file PlotBase.h.
References fDrawFirst.
Referenced by PlotBrazil::MakePlot().
§ SetDrawOpts()
|
inline |
Set additional drawing options to force all lines to have.
Definition at line 194 of file PlotBase.h.
References fDrawOpts.
§ SetFontSize()
|
inline |
Sets the fontsize of the axis labels.
Definition at line 77 of file PlotBase.h.
References fFontSize.
§ SetIncludeErrorBars()
|
inline |
Set this to true to feature error bars in the plots.
Definition at line 117 of file PlotBase.h.
References fIncludeErrorBars.
Referenced by PlotStack::MakeCanvas().
§ SetLeftMargin()
|
inline |
Definition at line 196 of file PlotBase.h.
References fLeftMargin.
§ SetLegendBorderSize()
|
inline |
Set the legend border size.
Definition at line 136 of file PlotBase.h.
References fLegendBorderSize.
§ SetLegendFill()
|
inline |
If true, the legend will be filled with a solid background.
Definition at line 138 of file PlotBase.h.
References fLegendFill.
Referenced by PlotStack::MakeCanvas().
§ SetLegendLimits()
|
inline |
§ SetLegendLocation()
|
inline |
Set the legend location using LegendY and LegendX enums.
This function is designed to be lazy about putting legends There are nice enums, like kUpper, kLower and kLeft, kRight The width and height are then fractions of the canvas.
Definition at line 399 of file PlotBase.h.
§ SetLumiLabel() [1/2]
|
inline |
Set the luminosity label.
Definition at line 174 of file PlotBase.h.
References fLumiLabel.
Referenced by PlotStack::MakeCanvas().
§ SetLumiLabel() [2/2]
|
inline |
Set the luminosity lable with a float in fb.
Definition at line 178 of file PlotBase.h.
References fLumiLabel, and fLumiLabelFormat.
§ SetLumiLabelFormat()
|
inline |
§ SetMakeRatio()
|
inline |
If true, a ratio pad will be drawn underneath.
Definition at line 147 of file PlotBase.h.
References fMakeRatio.
Referenced by HistAnalysis::PlotScaleFactors().
§ SetRatioDivisions()
|
inline |
Sets the divisions of the ratio y axis.
Definition at line 163 of file PlotBase.h.
References fOptimDivisions, and fRatioDivisions.
§ SetRatioGrid()
|
inline |
Set horizontal dotted lines on the ratio pad.
Definition at line 161 of file PlotBase.h.
References fRatioGrid.
§ SetRatioIndex()
|
inline |
Set which line will be '1' in the ratio plot.
Definition at line 149 of file PlotBase.h.
References fRatioIndex.
Referenced by PlotStack::MakeCanvas(), and HistAnalysis::PlotScaleFactors().
§ SetRatioMinMax()
|
inline |
Force the minimum and maximum values of the ratio pad.
Definition at line 157 of file PlotBase.h.
§ SetRatioTitle()
|
inline |
Set the y axis label of the ratio pad.
Definition at line 159 of file PlotBase.h.
References fRatioTitle, and backupslides::title.
§ SetTreeList()
|
inline |
Can store multiple trees at once for plots. Each tree plots its own line.
Definition at line 95 of file PlotBase.h.
References fInTrees.
§ TempHistName()
|
inlineprotected |
Get a temporary name for a histogram.
Definition at line 200 of file PlotBase.h.
References fPlotCounter.
Referenced by PlotStack::MakeCanvas().
Member Data Documentation
§ bC
|
protected |
If true, BaseCanvas will create a .C macro.
Definition at line 251 of file PlotBase.h.
Referenced by BaseCanvas(), PlotFitParameters::DoFit(), Plot2D::DoFit(), OnlyPDF(), and OnlyPNG().
§ bPDF
|
protected |
If true, BaseCanvas will create a .pdf file.
Definition at line 249 of file PlotBase.h.
Referenced by BaseCanvas(), PlotFitParameters::DoFit(), Plot2D::DoFit(), and OnlyPNG().
§ bPNG
|
protected |
If true, BaseCanvas will create a .png file.
Definition at line 250 of file PlotBase.h.
Referenced by BaseCanvas(), PlotFitParameters::DoFit(), Plot2D::DoFit(), and OnlyPDF().
§ fAxisMax
|
protected |
Maximum value of the y-axis.
Definition at line 227 of file PlotBase.h.
Referenced by BaseCanvas(), PlotROC::MakeCanvas(), and SetAxisMinMax().
§ fAxisMin
|
protected |
Minimum value of the y-axis.
If fAxisMin is the same value as fAxisMax, then both values are ignored and the axis height is determined by the first line plotted.
Definition at line 226 of file PlotBase.h.
Referenced by BaseCanvas(), PlotROC::MakeCanvas(), and SetAxisMinMax().
§ fCanvasHeight
|
private |
The height of the output canvas.
Definition at line 256 of file PlotBase.h.
Referenced by BaseCanvas(), and SetCanvasSize().
§ fCanvasName
|
private |
The name of the output canvas.
Definition at line 254 of file PlotBase.h.
Referenced by BaseCanvas(), and SetCanvasName().
§ fCanvasWidth
|
private |
The width of the output canvas.
Definition at line 255 of file PlotBase.h.
Referenced by BaseCanvas(), and SetCanvasSize().
§ fCMSLabel
|
private |
Label to give next to CMS on plots.
Definition at line 271 of file PlotBase.h.
Referenced by BaseCanvas(), and SetCMSLabel().
§ fCutColor
|
private |
Color of the cuts lines.
Definition at line 281 of file PlotBase.h.
Referenced by DrawCutLines(), and SetCutLineStyle().
§ fCutLines
|
private |
Locations for dashed lines for cuts, and bools for verticality.
Definition at line 280 of file PlotBase.h.
Referenced by AddCutLine(), DrawCutLines(), and ResetCutLines().
§ fCutStyle
|
private |
Style of the cuts lines.
Definition at line 283 of file PlotBase.h.
Referenced by DrawCutLines(), and SetCutLineStyle().
§ fCutWidth
|
private |
Width of the cuts lines.
Definition at line 282 of file PlotBase.h.
Referenced by DrawCutLines(), and SetCutLineStyle().
§ fCutXMax
|
private |
Maximum value of cut line x.
Definition at line 287 of file PlotBase.h.
Referenced by DrawCutLines(), and LineDrawing().
§ fCutXMin
|
private |
Minimum value of cut line x.
Definition at line 286 of file PlotBase.h.
Referenced by DrawCutLines(), and LineDrawing().
§ fCutYMax
|
private |
Maximum value of cut line y.
Definition at line 285 of file PlotBase.h.
Referenced by DrawCutLines(), and LineDrawing().
§ fCutYMin
|
private |
Minimum value of cut line y.
Definition at line 284 of file PlotBase.h.
Referenced by DrawCutLines(), and LineDrawing().
§ fDataIndex
|
protected |
Index in the plotter of the data line.
Definition at line 229 of file PlotBase.h.
Referenced by BaseCanvas(), LineDrawing(), PlotStack::MakeCanvas(), and SetDataIndex().
§ fDefaultCut
|
protected |
Default cut if needed.
Definition at line 204 of file PlotBase.h.
Referenced by AddLine(), AddTreeExpr(), AddTreeWeight(), AddWeightExpr(), Plot2D::DoFits(), GetDefaultWeight(), FileConfigReader::GetHistList(), PlotFitParameters::GetMeans(), PlotStack::MakeCanvas(), PlotHists::MakeHists(), and SetDefaultWeight().
§ fDefaultExpr
|
protected |
Default resolution expression if needed.
Definition at line 205 of file PlotBase.h.
Referenced by AddLine(), AddTreeExpr(), AddTreeWeight(), AddWeightExpr(), Plot2D::DoFits(), FileConfigReader::GetHistList(), PlotFitParameters::GetMeans(), PlotStack::MakeCanvas(), PlotHists::MakeHists(), and SetDefaultExpr().
§ fDefaultLineStyle
|
private |
Line style to use on all plots.
Definition at line 260 of file PlotBase.h.
Referenced by AddLegendEntry(), BaseCanvas(), and SetDefaultLineStyle().
§ fDefaultLineWidth
|
private |
Line width to make all plots.
Definition at line 259 of file PlotBase.h.
Referenced by AddLegendEntry(), BaseCanvas(), and SetDefaultLineWidth().
§ fDefaultTree
|
protected |
Default Tree if needed.
Definition at line 203 of file PlotBase.h.
Referenced by AddLine(), AddTreeExpr(), AddTreeWeight(), AddWeightExpr(), Plot2D::DoFits(), PlotFitParameters::GetMeans(), PlotHists::MakeHists(), and SetDefaultTree().
§ fDeleteThese
|
private |
Vector of object pointers to free memory at the end.
Definition at line 275 of file PlotBase.h.
Referenced by BaseCanvas(), DrawCutLines(), and LineDrawing().
§ fDrawFirst
|
private |
Can force one of the lines to be drawn first.
Definition at line 267 of file PlotBase.h.
Referenced by BaseCanvas(), and SetDrawFirst().
§ fDrawOpts
|
private |
The options that all lines are drawn with.
Definition at line 289 of file PlotBase.h.
Referenced by GetOpts(), and SetDrawOpts().
§ fFontSize
|
private |
The size of the font used in the axis titles.
Definition at line 258 of file PlotBase.h.
Referenced by BaseCanvas(), and SetFontSize().
§ fIncludeErrorBars
|
protected |
Option to include error bars.
Definition at line 218 of file PlotBase.h.
Referenced by SetIncludeErrorBars().
§ fInCuts
|
protected |
Holds the cuts for the trees if needed.
Definition at line 214 of file PlotBase.h.
Referenced by AddLine(), AddTreeWeight(), AddWeight(), AddWeightExpr(), Plot2D::DoFits(), PlotFitParameters::GetMeans(), PlotHists::MakeHists(), and ResetWeight().
§ fInExpr
|
protected |
Holds multiple resolution expressions if needed.
Definition at line 215 of file PlotBase.h.
Referenced by AddExpr(), AddLine(), AddTreeExpr(), AddWeightExpr(), Plot2D::DoFits(), PlotFitParameters::GetMeans(), PlotHists::MakeHists(), and ResetExpr().
§ fInTrees
|
protected |
Holds all the trees for each line if needed.
Definition at line 213 of file PlotBase.h.
Referenced by AddLine(), AddTree(), AddTreeExpr(), AddTreeWeight(), FileConfigReader::CloseFiles(), Plot2D::DoFits(), PlotFitParameters::GetMeans(), PlotHists::MakeHists(), CutflowMaker::MakePlot(), FileConfigReader::OpenFiles(), ResetTree(), and SetTreeList().
§ fLeftMargin
|
private |
Definition at line 290 of file PlotBase.h.
Referenced by BaseCanvas(), and SetLeftMargin().
§ fLegendBorderSize
|
protected |
Border size of legend.
Definition at line 211 of file PlotBase.h.
Referenced by BaseCanvas(), and SetLegendBorderSize().
§ fLegendEntries
|
protected |
Number of legend entries should match number of lines.
Definition at line 240 of file PlotBase.h.
Referenced by AddLegendEntry(), BaseCanvas(), Plot2D::DoFits(), QuickPlot::MakeCanvas(), and ResetLegend().
§ fLegendFill
|
private |
Gives fill option to legend drawing.
Definition at line 266 of file PlotBase.h.
Referenced by BaseCanvas(), and SetLegendFill().
§ fLineColors
|
private |
Colors of each of the lines.
Definition at line 262 of file PlotBase.h.
Referenced by AddLegendEntry(), BaseCanvas(), and ResetLegend().
§ fLineStyles
|
private |
Styles of each of the lines.
Definition at line 264 of file PlotBase.h.
Referenced by AddLegendEntry(), BaseCanvas(), and ResetLegend().
§ fLineWidths
|
private |
Widths of each of the lines.
Definition at line 263 of file PlotBase.h.
Referenced by AddLegendEntry(), BaseCanvas(), and ResetLegend().
§ fLumiLabel
|
private |
Label used to show luminosity.
Definition at line 270 of file PlotBase.h.
Referenced by BaseCanvas(), and SetLumiLabel().
§ fLumiLabelFormat
|
private |
Format used for changing lumi numbers into string.
Definition at line 269 of file PlotBase.h.
Referenced by SetLumiLabel(), and SetLumiLabelFormat().
§ fMakeRatio
|
protected |
Bool to make a ratio plot on bottom of image.
Definition at line 230 of file PlotBase.h.
Referenced by BaseCanvas(), PlotStack::MakeCanvas(), and SetMakeRatio().
§ fOptimDivisions
|
protected |
Definition at line 237 of file PlotBase.h.
Referenced by BaseCanvas(), and SetRatioDivisions().
§ fPlotCounter
|
protected |
This is used so that making scratch plots does not overlap.
Definition at line 201 of file PlotBase.h.
Referenced by Plot2D::DoFits(), PlotFitParameters::GetMeans(), PlotHists::MakeHists(), and TempHistName().
§ fRatioDivisions
|
protected |
Definition at line 236 of file PlotBase.h.
Referenced by BaseCanvas(), and SetRatioDivisions().
§ fRatioGrid
|
protected |
Definition at line 235 of file PlotBase.h.
Referenced by BaseCanvas(), and SetRatioGrid().
§ fRatioIndex
|
protected |
Pick which line to set as 1 in ratio plot.
Definition at line 231 of file PlotBase.h.
Referenced by BaseCanvas(), LineDrawing(), and SetRatioIndex().
§ fRatioLines
|
protected |
Vector of line indices to show up in the ratio pad.
Definition at line 238 of file PlotBase.h.
Referenced by AddRatioLine(), BaseCanvas(), and PlotStack::MakeCanvas().
§ fRatioMax
|
protected |
Maximum of the ratio pad.
Definition at line 233 of file PlotBase.h.
Referenced by BaseCanvas(), and SetRatioMinMax().
§ fRatioMin
|
protected |
Minimum of the ratio pad.
Definition at line 232 of file PlotBase.h.
Referenced by BaseCanvas(), and SetRatioMinMax().
§ fRatioTitle
|
protected |
Label of the ratio pad.
Definition at line 234 of file PlotBase.h.
Referenced by BaseCanvas(), and SetRatioTitle().
§ fSystematicBranches
|
protected |
Vector of branches to apply as systematic uncertainties.
Definition at line 216 of file PlotBase.h.
Referenced by AddSystematicBranch(), FileConfigReader::GetHistList(), and ResetSystematics().
§ fTitleOffset
|
private |
The offset of the Y-axis title to account for large numbers.
Definition at line 257 of file PlotBase.h.
Referenced by BaseCanvas(), and SetAxisTitleOffset().
§ l1
|
protected |
First X value of legend location.
Definition at line 207 of file PlotBase.h.
Referenced by BaseCanvas(), SetLegendLimits(), and SetLegendLocation().
§ l2
|
protected |
First Y value of legend location.
Definition at line 208 of file PlotBase.h.
Referenced by BaseCanvas(), SetLegendLimits(), and SetLegendLocation().
§ l3
|
protected |
Second X value of legend location.
Definition at line 209 of file PlotBase.h.
Referenced by BaseCanvas(), SetLegendLimits(), and SetLegendLocation().
§ l4
|
protected |
Second Y value of legend location.
Definition at line 210 of file PlotBase.h.
Referenced by BaseCanvas(), SetLegendLimits(), and SetLegendLocation().
The documentation for this class was generated from the following file:
