A flexible class that plots histograms. More...
#include <PlotHists.h>
 Inheritance diagram for PlotHists:
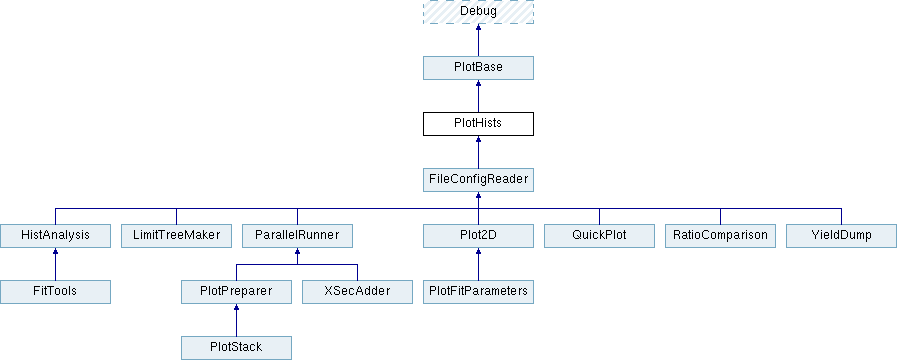
Public Member Functions | |
| PlotHists () | |
| virtual | ~PlotHists () |
| void | AddUncertainty (UInt_t index, TString FileName, TString HistName, Int_t startBin=1, Int_t endBin=0) |
| Add uncertainty factors to some index of histograms about to be made. More... | |
| virtual void | MakeCanvas (TString FileBase, Int_t NumXBins, Double_t *XBins, TString XLabel, TString YLabel, Bool_t logY=false) |
| Alternatively, we can set values in PlotBase and then just give the binning. More... | |
| virtual void | MakeCanvas (TString FileBase, Int_t NumXBins, Double_t MinX, Double_t MaxX, TString XLabel, TString YLabel, Bool_t logY=false) |
| void | MakeCanvas (TString FileBase, std::vector< TH1D *> theHists, TString XLabel, TString YLabel, Bool_t logY=false) |
| Simplest of Canvas makers with just histograms as arugments, allowing for user manipulation of histograms. More... | |
| std::vector< TH1D * > | MakeHists (Int_t NumXBins, Double_t *XBins) |
| This just return vectors of histograms for other uses. More... | |
| std::vector< TH1D * > | MakeHists (Int_t NumXBins, Double_t MinX, Double_t MaxX) |
| void | SetEventsPer (Double_t per) |
| We can set events per some value of x so that our legend entry is not wrong and variable binning doesn't look stupid. More... | |
| void | SetNormalizedHists (Bool_t b) |
| We can set normalization to match a particular other hist (or just 1) More... | |
| void | SetNormalizeTo (Int_t to) |
| Set index of which histogram to normalize to. More... | |
| void | SetUncertaintySquared (TString expr) |
| Add uncertainty factors through branch expressions instead of a histogram. More... | |
| Public Member Functions inherited from PlotBase | |
| PlotBase () | |
| virtual | ~PlotBase () |
| void | AddCutLine (Double_t loc, bool is_vert=true) |
| Adds a dotted line in order to show cuts. More... | |
| void | AddExpr (TString expr) |
| Set an x expression for a single line. More... | |
| void | AddLegendEntry (TString LegendEntry, Color_t ColorEntry) |
| Set entry and color for each line. This uses the default line width and style. More... | |
| void | AddLegendEntry (TString LegendEntry, Color_t ColorEntry, Int_t LineWidth, Int_t LineStyle) |
| Set entry, color, width, and style for each line. More... | |
| void | AddLine (TTree *tree, TCut cut, TString expr) |
| This function adds a tree pointer, cut, and expression used for generating a line in the plot. More... | |
| void | AddLine (TTree *tree, const char *cut, TString expr) |
| This function adds a tree pointer, cut, and expression used for generating a line in the plot. More... | |
| void | AddRatioLine (Int_t line) |
| Add a line to show in the ratio plot. More... | |
| void | AddSystematicBranch (TString branch) |
| Add branches that contain independent systematic uncertainties to show in the plots. More... | |
| void | AddTree (TTree *tree) |
| Set a tree for a single line. More... | |
| void | AddTreeExpr (TTree *tree, TString expr) |
| Set a tree and expression concurrently for each line. Best used when a default weight is set. More... | |
| void | AddTreeWeight (TTree *tree, TCut cut) |
| Set a tree and weight concurrently for each line. Best used when a default expression is set. More... | |
| void | AddTreeWeight (TTree *tree, const char *cut) |
| Set a tree and weight concurrently for each line. Best used when a default expression is set. More... | |
| void | AddWeight (TCut cut) |
| Set a weight for a single line. More... | |
| void | AddWeight (const char *cut) |
| Set a weight for a single line. More... | |
| void | AddWeightExpr (TCut cut, TString expr) |
| Set a weight and expression concurrently for each line. Best used when a default tree is set. More... | |
| void | AddWeightExpr (const char *cut, TString expr) |
| Set a weight and expression concurrently for each line. Best used when a default tree is set. More... | |
| TCut | GetDefaultWeight () const |
| Get the default weight. More... | |
| void | OnlyPDF () |
| Call this before plotting to only write plots to .pdf files. More... | |
| void | OnlyPNG () |
| Call this before plotting to only write plots to .png files. More... | |
| void | ResetCutLines () |
| Resets the number of cut lines to plot. More... | |
| void | ResetExpr () |
| Reset the list of expressions used to makes lines. More... | |
| void | ResetLegend () |
| Resets the legend entries for each line. More... | |
| void | ResetSystematics () |
| Reset list of branches that contain systematics. More... | |
| void | ResetTree () |
| Reset the list of trees used to makes lines. More... | |
| void | ResetWeight () |
| Reset the list of weights used to makes lines. More... | |
| void | SetAxisMinMax (Float_t min, Float_t max) |
| Forces the minimum and maximum values of the Y-axis in the plot. More... | |
| void | SetAxisTitleOffset (Float_t offset) |
| Sets the offset of the Y-axis title as a ratio of the default offset. More... | |
| void | SetCanvasName (TString name) |
| Sets the name of the canvas created by PlotBase. More... | |
| void | SetCanvasSize (Int_t width, Int_t height) |
| Sets the size of the output canvas. More... | |
| void | SetCMSLabel (TString type) |
| Set the type of CMS label for the plot. More... | |
| void | SetCutLineStyle (Color_t color, Int_t width, Int_t style) |
| Sets the style for the cut lines. More... | |
| void | SetDataIndex (Int_t data) |
| Set one of the lines to be plotted as data. More... | |
| void | SetDefaultCut (const char *cut) |
| void | SetDefaultExpr (TString expr) |
| Set the default expression to be plotted on the x-axis for each line in the plot. More... | |
| void | SetDefaultLineStyle (Int_t style) |
| Set the default line style. More... | |
| void | SetDefaultLineWidth (Int_t width) |
| Set the default line width. More... | |
| void | SetDefaultTree (TTree *tree) |
| Set the default tree pointer for each line in the plot. More... | |
| void | SetDefaultWeight (TCut cut) |
| Set the default weight for each line in the plot. More... | |
| void | SetDefaultWeight (const char *cut) |
| Set the default weight for each line in the plot. More... | |
| void | SetDrawFirst (Int_t first) |
| Force a line to draw first on the plot, if desired. More... | |
| void | SetDrawOpts (TString options) |
| Set additional drawing options to force all lines to have. More... | |
| void | SetFontSize (Float_t fontSize) |
| Sets the fontsize of the axis labels. More... | |
| void | SetIncludeErrorBars (Bool_t include) |
| Set this to true to feature error bars in the plots. More... | |
| void | SetLeftMargin (float left) |
| void | SetLegendBorderSize (Int_t size) |
| Set the legend border size. More... | |
| void | SetLegendFill (Bool_t fill) |
| If true, the legend will be filled with a solid background. More... | |
| void | SetLegendLimits (Double_t lim1, Double_t lim2, Double_t lim3, Double_t lim4) |
| Set the legend location manually. More... | |
| void | SetLegendLocation (LegendY yLoc, LegendX xLoc, Double_t xWidth=0.3, Double_t yWidth=0.2) |
| Set the legend location using LegendY and LegendX enums. More... | |
| void | SetLumiLabel (TString lumi) |
| Set the luminosity label. More... | |
| void | SetLumiLabel (Float_t lumi) |
| Set the luminosity lable with a float in fb. More... | |
| void | SetLumiLabelFormat (TString format) |
| Set the luminosity format. More... | |
| void | SetMakeRatio (Bool_t ratio) |
| If true, a ratio pad will be drawn underneath. More... | |
| void | SetRatioDivisions (Int_t divisions, Bool_t optimize=true) |
| Sets the divisions of the ratio y axis. More... | |
| void | SetRatioGrid (Int_t grid) |
| Set horizontal dotted lines on the ratio pad. More... | |
| void | SetRatioIndex (Int_t ratio) |
| Set which line will be '1' in the ratio plot. More... | |
| void | SetRatioMinMax (Float_t min, Float_t max) |
| Force the minimum and maximum values of the ratio pad. More... | |
| void | SetRatioTitle (TString title) |
| Set the y axis label of the ratio pad. More... | |
| void | SetTreeList (std::vector< TTree *> treelist) |
| Can store multiple trees at once for plots. Each tree plots its own line. More... | |
| Public Member Functions inherited from Debug | |
| Debug () | |
| virtual | ~Debug () |
| DebugLevel | GetDebugLevel () |
| Gets the verbosity for a class. More... | |
| template<typename T , typename... V> | |
| void | Message (DebugLevel level, T message, V... more) |
| Sends a message if the verbosity level is appropriate. More... | |
| void | Message (DebugLevel level) |
| void | SetDebugLevel (DebugLevel level) |
| Sets the verbosity for a class. More... | |
Protected Attributes | |
| Double_t | fEventsPer = 0 |
| Histogram normalized to events per units of X axis. More... | |
| Protected Attributes inherited from PlotBase | |
| Bool_t | bC = true |
| If true, BaseCanvas will create a .C macro. More... | |
| Bool_t | bPDF = true |
| If true, BaseCanvas will create a .pdf file. More... | |
| Bool_t | bPNG = true |
| If true, BaseCanvas will create a .png file. More... | |
| Float_t | fAxisMax = 0.0 |
| Maximum value of the y-axis. More... | |
| Float_t | fAxisMin = 0.0 |
| Minimum value of the y-axis. More... | |
| Int_t | fDataIndex = -1 |
| Index in the plotter of the data line. More... | |
| TCut | fDefaultCut = "" |
| Default cut if needed. More... | |
| TString | fDefaultExpr = "" |
| Default resolution expression if needed. More... | |
| TTree * | fDefaultTree = NULL |
| Default Tree if needed. More... | |
| Bool_t | fIncludeErrorBars = true |
| Option to include error bars. More... | |
| std::vector< TCut > | fInCuts |
| Holds the cuts for the trees if needed. More... | |
| std::vector< TString > | fInExpr |
| Holds multiple resolution expressions if needed. More... | |
| std::vector< TTree * > | fInTrees |
| Holds all the trees for each line if needed. More... | |
| Int_t | fLegendBorderSize = 0 |
| Border size of legend. More... | |
| std::vector< TString > | fLegendEntries |
| Number of legend entries should match number of lines. More... | |
| Bool_t | fMakeRatio = false |
| Bool to make a ratio plot on bottom of image. More... | |
| Bool_t | fOptimDivisions |
| UInt_t | fPlotCounter = 0 |
| This is used so that making scratch plots does not overlap. More... | |
| Int_t | fRatioDivisions |
| Int_t | fRatioGrid |
| Int_t | fRatioIndex = -1 |
| Pick which line to set as 1 in ratio plot. More... | |
| std::vector< Int_t > | fRatioLines |
| Vector of line indices to show up in the ratio pad. More... | |
| Float_t | fRatioMax = 0.0 |
| Maximum of the ratio pad. More... | |
| Float_t | fRatioMin = 0.0 |
| Minimum of the ratio pad. More... | |
| TString | fRatioTitle |
| Label of the ratio pad. More... | |
| std::vector< TString > | fSystematicBranches |
| Vector of branches to apply as systematic uncertainties. More... | |
| Double_t | l1 = 0.6 |
| First X value of legend location. More... | |
| Double_t | l2 = 0.7 |
| First Y value of legend location. More... | |
| Double_t | l3 = 0.9 |
| Second X value of legend location. More... | |
| Double_t | l4 = 0.9 |
| Second Y value of legend location. More... | |
Private Attributes | |
| Bool_t | fNormalizedHists = false |
| Can normalize histograms in order to compare shapes. More... | |
| Int_t | fNormalizeTo = -1 |
| If not specified, normalized to 1. More... | |
| std::vector< UInt_t > | fSysUncIndices |
| Indices of histograms to apply systematic uncertainties. More... | |
| std::vector< UncertaintyInfo > | fUncerts |
| Uncertainties to apply to histograms. More... | |
| TString | fUncExpr = "" |
| Branch expressions to add to the systematic uncertainty. More... | |
Additional Inherited Members | |
| Public Types inherited from PlotBase | |
| enum | LegendX { kLeft = 0, kRight } |
| Used for horizontal position of legend. More... | |
| enum | LegendY { kUpper = 0, kLower } |
| Used for vertical position of legend. More... | |
| Public Types inherited from Debug | |
| enum | DebugLevel { eQuiet = 0, eError, eInfo, eDebug } |
| Different possible debug levels. More... | |
| Protected Member Functions inherited from PlotBase | |
| template<class T > | |
| void | BaseCanvas (TString FileBase, std::vector< T *> theLines, TString XLabel, TString YLabel, Bool_t logY=false, Bool_t logX=false) |
| This is the powerhouse of all the plotting tools. Everything happens here. More... | |
| void | ConvertToArray (Int_t NumXBins, Double_t MinX, Double_t MaxX, Double_t *XBins) |
| Takes number of bins, min and max, and dumps it into an already allocated array. More... | |
| TString | TempHistName () |
| Get a temporary name for a histogram. More... | |
| Protected Member Functions inherited from Debug | |
| void | DisplayFunc (const char *func) |
| Sends the name of the function during debuggin. More... | |
Detailed Description
A flexible class that plots histograms.
Many practical uses are mediated by other classes.
Definition at line 27 of file PlotHists.h.
Constructor & Destructor Documentation
§ PlotHists()
| PlotHists::PlotHists | ( | ) |
Definition at line 74 of file PlotHists.h.
§ ~PlotHists()
|
virtual |
Definition at line 78 of file PlotHists.h.
Member Function Documentation
§ AddUncertainty()
| void PlotHists::AddUncertainty | ( | UInt_t | index, |
| TString | FileName, | ||
| TString | HistName, | ||
| Int_t | startBin = 1, |
||
| Int_t | endBin = 0 |
||
| ) |
Add uncertainty factors to some index of histograms about to be made.
Definition at line 83 of file PlotHists.h.
References fSysUncIndices, and fUncerts.
§ MakeCanvas() [1/3]
|
virtual |
Alternatively, we can set values in PlotBase and then just give the binning.
Reimplemented in QuickPlot, and PlotStack.
Definition at line 231 of file PlotHists.h.
References PlotBase::BaseCanvas(), and MakeHists().
Referenced by MakeCanvas().
§ MakeCanvas() [2/3]
|
virtual |
Reimplemented in QuickPlot, and PlotStack.
Definition at line 243 of file PlotHists.h.
References PlotBase::ConvertToArray(), and MakeCanvas().
§ MakeCanvas() [3/3]
|
inline |
Simplest of Canvas makers with just histograms as arugments, allowing for user manipulation of histograms.
Definition at line 57 of file PlotHists.h.
References PlotBase::BaseCanvas().
§ MakeHists() [1/2]
| std::vector< TH1D * > PlotHists::MakeHists | ( | Int_t | NumXBins, |
| Double_t * | XBins | ||
| ) |
This just return vectors of histograms for other uses.
Definition at line 92 of file PlotHists.h.
References ApplyUncertainty(), Debug::DisplayFunc(), Division(), Debug::eDebug, Debug::eError, Debug::eInfo, PlotBase::fDefaultCut, PlotBase::fDefaultExpr, PlotBase::fDefaultTree, fEventsPer, PlotBase::fInCuts, PlotBase::fInExpr, PlotBase::fInTrees, fNormalizedHists, fNormalizeTo, PlotBase::fPlotCounter, fSysUncIndices, fUncerts, fUncExpr, Debug::Message(), and CrombieTools.PlotTools.PlotUtils::SetZeroError.
Referenced by TmvaClassifier::Apply(), FileConfigReader::GetHistList(), MakeCanvas(), MakeHists(), and PlotROC::MakeROC().
§ MakeHists() [2/2]
| std::vector< TH1D * > PlotHists::MakeHists | ( | Int_t | NumXBins, |
| Double_t | MinX, | ||
| Double_t | MaxX | ||
| ) |
Definition at line 222 of file PlotHists.h.
References PlotBase::ConvertToArray(), and MakeHists().
§ SetEventsPer()
|
inline |
We can set events per some value of x so that our legend entry is not wrong and variable binning doesn't look stupid.
Definition at line 54 of file PlotHists.h.
References fEventsPer.
Referenced by PlotStack::MakeCanvas().
§ SetNormalizedHists()
|
inline |
We can set normalization to match a particular other hist (or just 1)
Definition at line 50 of file PlotHists.h.
References fNormalizedHists.
§ SetNormalizeTo()
|
inline |
Set index of which histogram to normalize to.
Definition at line 52 of file PlotHists.h.
References fNormalizeTo.
§ SetUncertaintySquared()
|
inline |
Add uncertainty factors through branch expressions instead of a histogram.
Definition at line 48 of file PlotHists.h.
References fUncExpr.
Referenced by FileConfigReader::GetHistList().
Member Data Documentation
§ fEventsPer
|
protected |
Histogram normalized to events per units of X axis.
Definition at line 62 of file PlotHists.h.
Referenced by PlotStack::MakeCanvas(), MakeHists(), and SetEventsPer().
§ fNormalizedHists
|
private |
Can normalize histograms in order to compare shapes.
Definition at line 65 of file PlotHists.h.
Referenced by MakeHists(), and SetNormalizedHists().
§ fNormalizeTo
|
private |
If not specified, normalized to 1.
Definition at line 66 of file PlotHists.h.
Referenced by MakeHists(), and SetNormalizeTo().
§ fSysUncIndices
|
private |
Indices of histograms to apply systematic uncertainties.
Definition at line 67 of file PlotHists.h.
Referenced by AddUncertainty(), and MakeHists().
§ fUncerts
|
private |
Uncertainties to apply to histograms.
Definition at line 68 of file PlotHists.h.
Referenced by AddUncertainty(), and MakeHists().
§ fUncExpr
|
private |
Branch expressions to add to the systematic uncertainty.
Definition at line 69 of file PlotHists.h.
Referenced by MakeHists(), and SetUncertaintySquared().
The documentation for this class was generated from the following file:
